Design Analysis and Comparison #
The analysis tab uses pie charts and bar charts to analyze the LCA of one or more designs. The analysis allows you to identify hotspots for each life cycle phase and compare different designs.
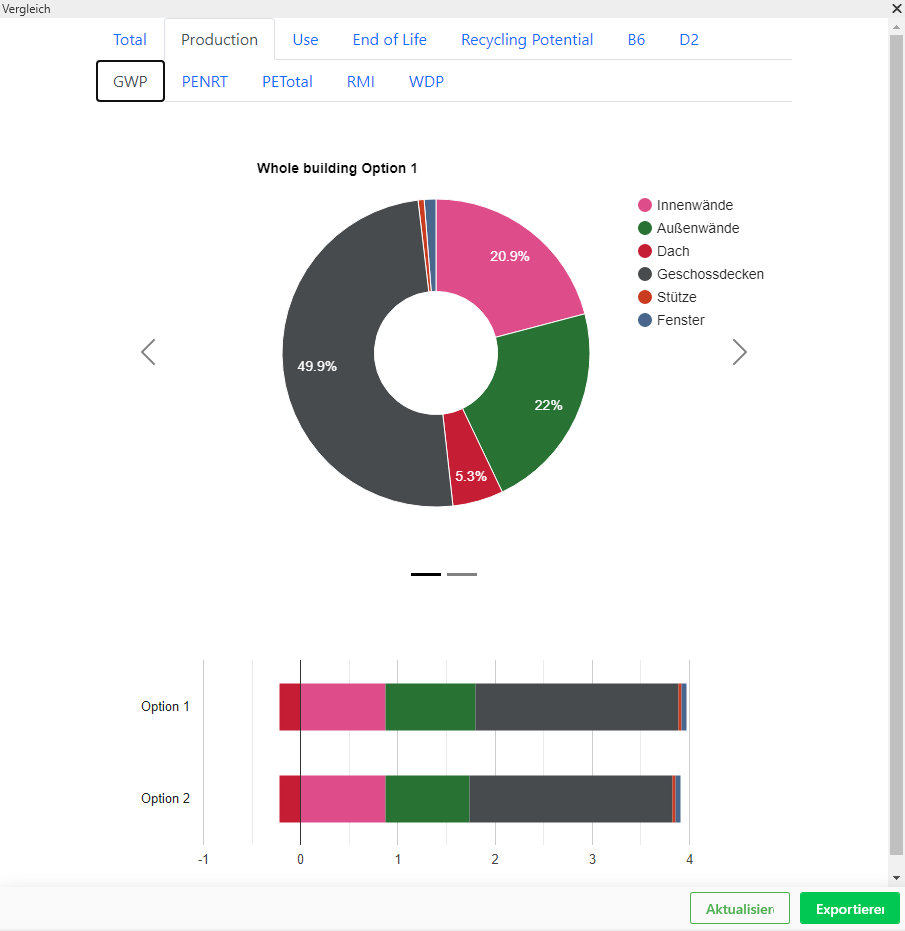
Note: Only designs within the same LCA approach can be compared.
Decision-making process #
Coming soon
© 2024 SURAP Gmbh. All rights reserved